What is a function derivative and how to optimize functions
A derivative is one of the basic things to understand in machine learning because derivatives are used to optimize the learning process. Let’s take a look at what derivatives are and what tasks they help with.
What is a function
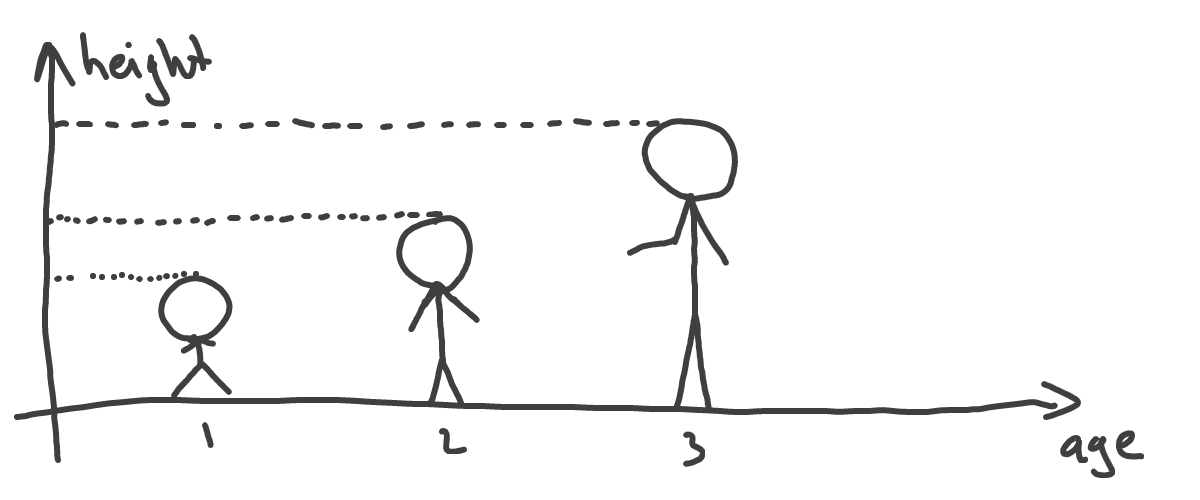
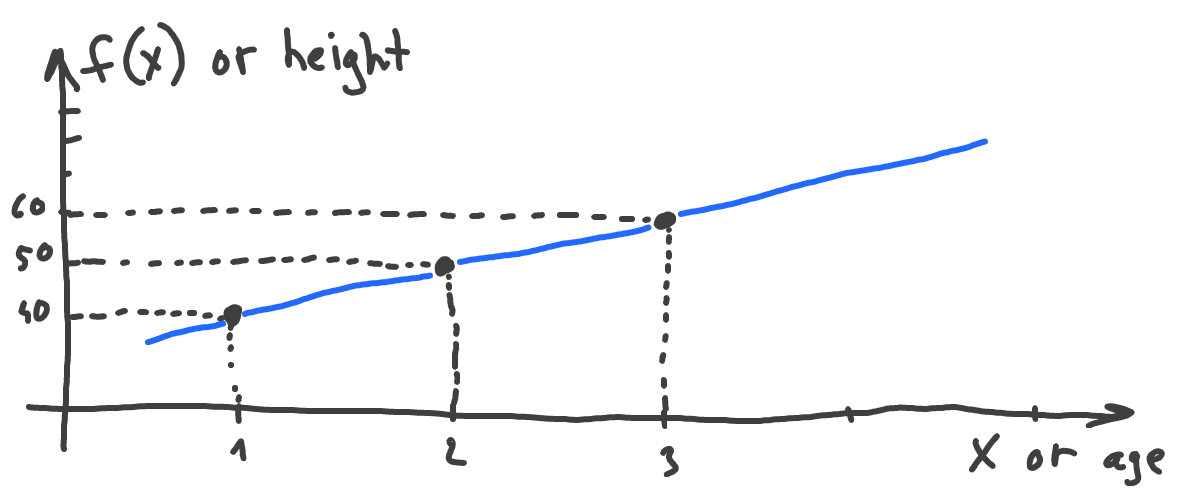
We’ll start from the start. What’s a function? Let’s take two things that can describe a child - height, and age. We can say, that, to some extent, height depends on age. There is a certain height average value for all children of one year old. Height average changes for children of two years old, three years old, etc:
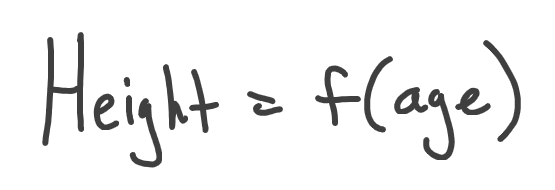
So, again, height depends on age. In the language of math we say, that height is a function of age:
When say that one variable is dependent on another variable, we usually name those variables Y and x respectively, which gives us the most familiar form of a function:
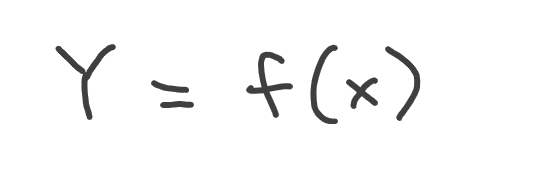
Where Y is our child’s height, and x is its age.
Change of a function
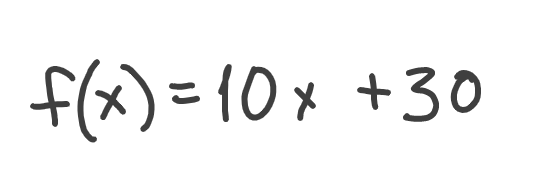
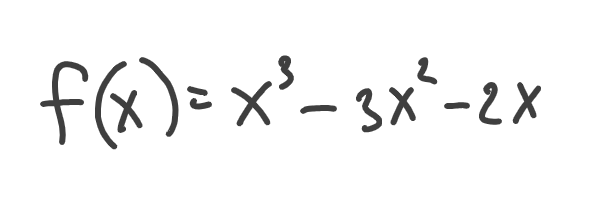
Okay, we know that height is a function of age, meaning height depends on age. Somehow. But how exactly? This is usually defined by the function itself, let’s say this one:
In other words, we can calculate height (which is f(x)) for any given age (which is x). We can even plot this function:
Now let’s answer the following question: if we take the point where x = 2 (which means the age of 2 years), and we would like to know what happens with height (the function) if we move slightly to the right (say, point of 2 years and 1 month):
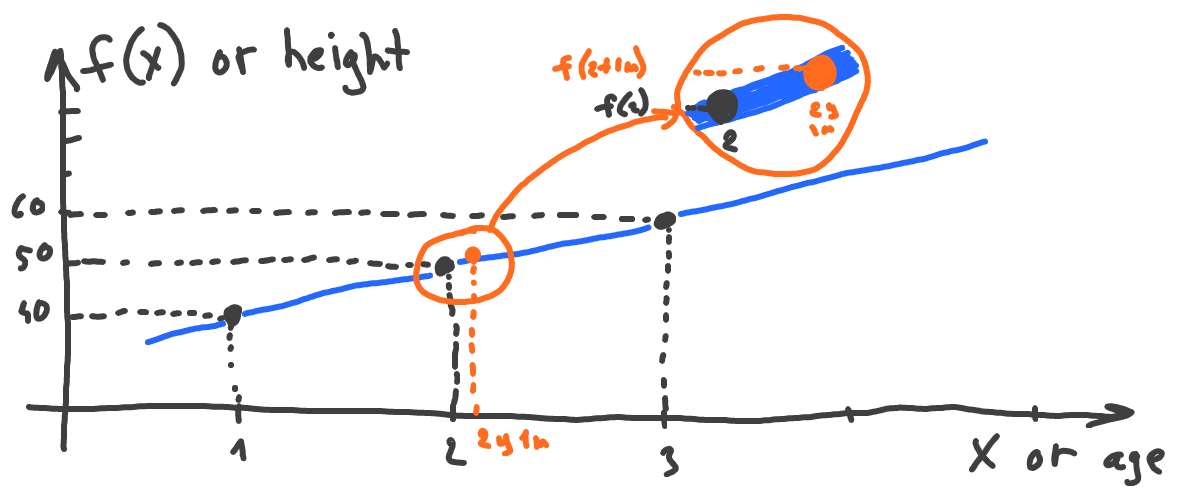
Will function (height) increase or decrease? It’s obvious that it increases given our chart (the line always goes up). But what if we have a more complex example:
Will it go up or down if we move to the right of the x=2 point a little? Let’s plot to see:
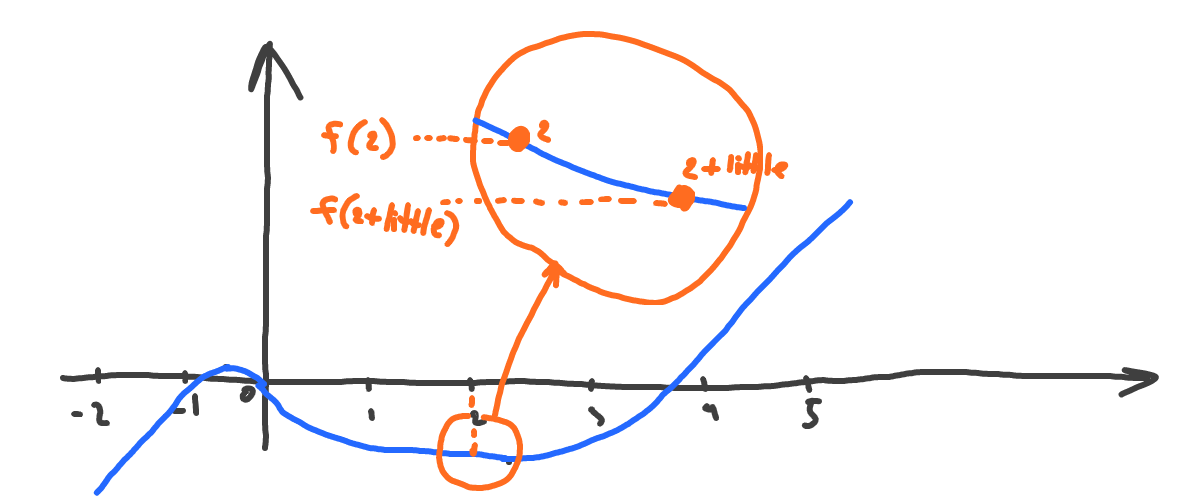
It goes down at the point of x=2 if we move to the right. This was harder to spot this time, so can we tell that without having to plot a function at all?
Direction of change of a function
How do we know if the function goes up or down at a certain point if we move slightly to the right? Let’s pick a point of 2 and a second point, which is a bit to the right from it. But this time, let’s just calculate values instead of plotting the whole function. We’ll take x1 = 2 and x2 = 2 + 0.01 (slight to the right from x1):
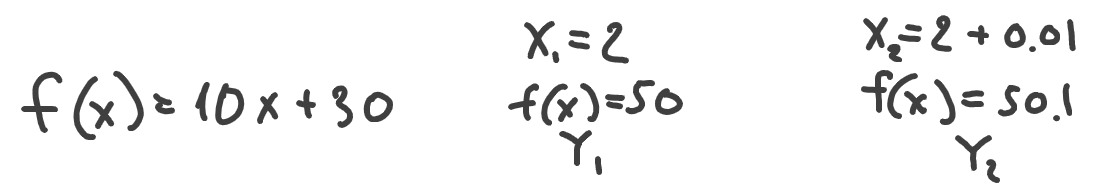
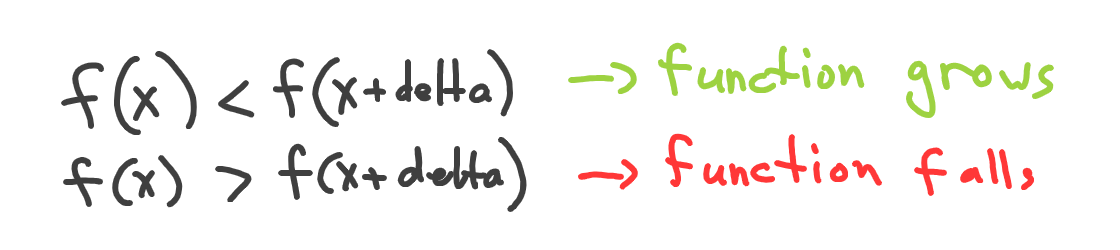
Obviously, if Y2 is bigger than Y1 then we can say that our function will go up. If Y2 had been less than Y1, the function would have gone down. Let’s double-check the more complex example from above:
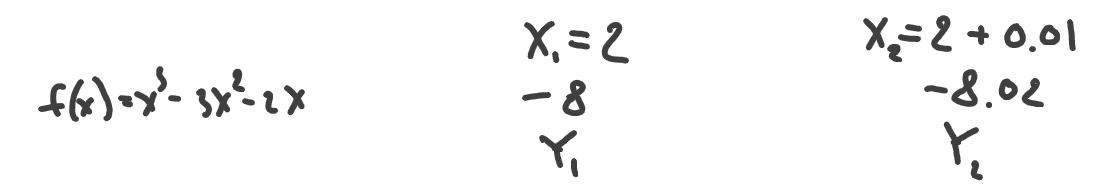
Yep, as we’ve seen on the chart, the function goes down as -8.02 is less than -8. Now we can define the direction of any function at any point without having to plot it, by just calculating and comparing its values:
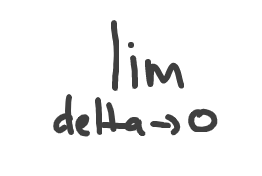
Where delta — is a very small value by which we move from the point of finding direction. In fact, the delta should be so small, it’s almost zero (but not exactly zero) to have good calculation results. In terms of math, delta should approach zero, and is denoted like this:
Strength of change of a function
Now what if we want to understand how fast our function goes up or down? E.g., if we are at the point of 2, we know our function goes up when we move slightly to the right. But what steepness does the function go up with? As for our example, we’re trying to understand the following: how fast the child grows based on its age.
The strength of change (or steepness) is easy to define. Let’s see how our Y changes in comparison to how x changes:
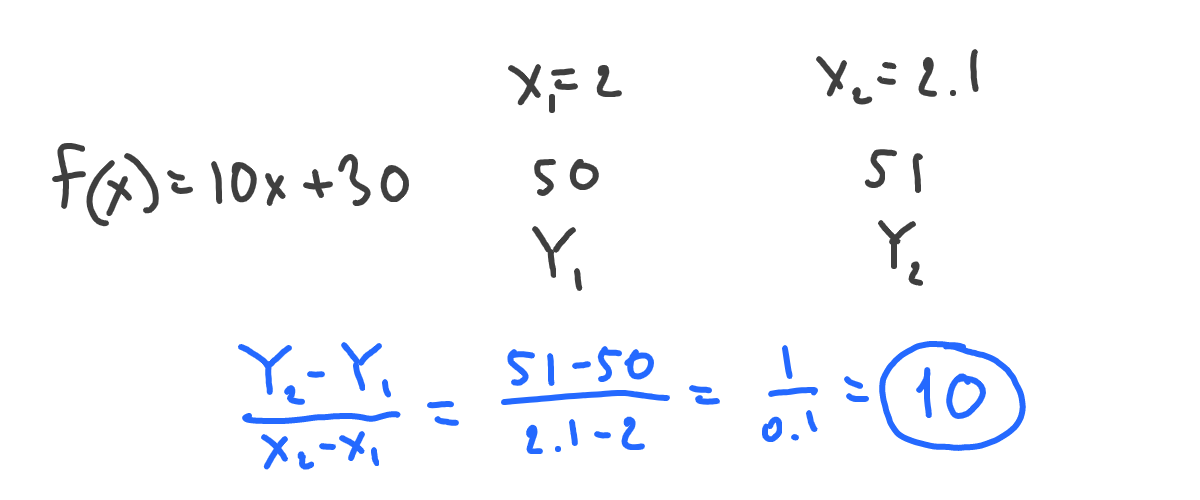
Now we can say, that the steepness (strength of growth) of function is 10. Meaning that, at the age of 2 (where we’ve calculated it), if we move slightly to the right (say, at an age of 2 years and 1 month), our function (height) will react with an increase of 10 times that age change.
Let’s also do the same for the more complex example:
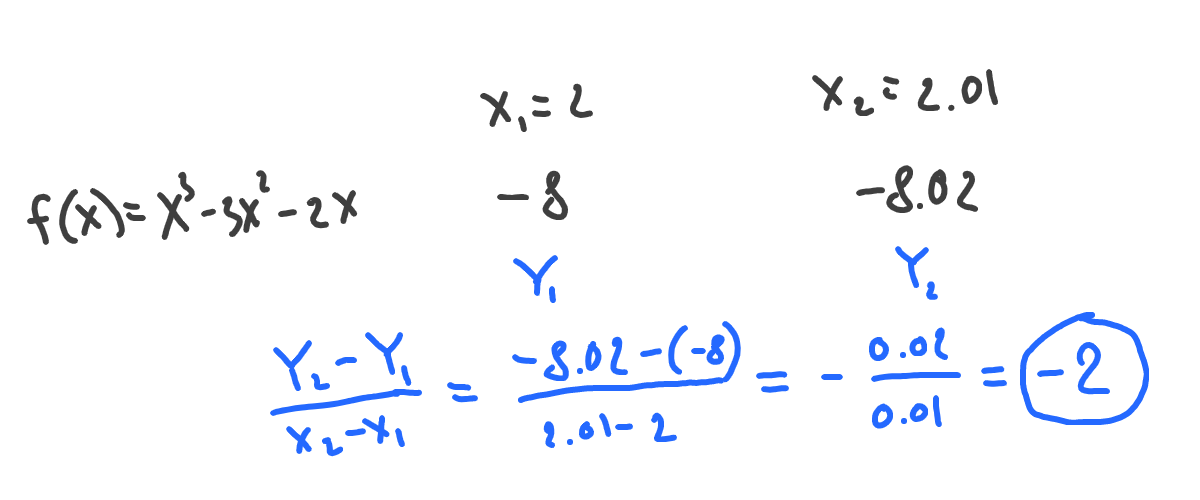
Meaning that at the point of 2, our function will decrease 2 times if we slightly move to the right. Remember, that function decreases when the sign of the change is negative.
Tangent and slope
Again, let’s see how the second function changes at the point where x=2 on the chart, but this time, let’s draw a line that goes through both x=2 and x=2.01 (the point which is slight to the right from 2):
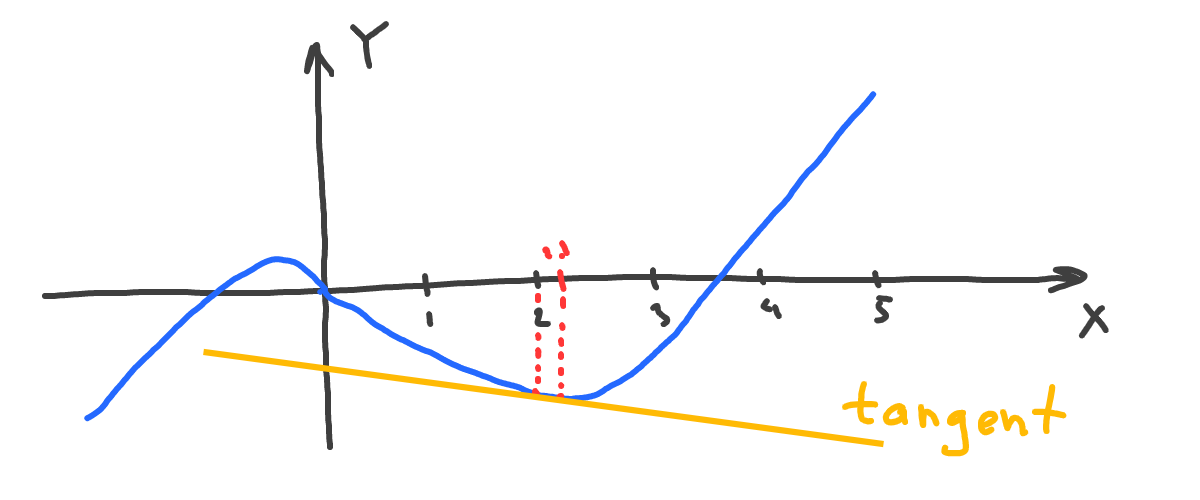
That yellow line is also called a tangent. This is another way to visually understand how our function changes and in what direction.
The slope of tangent shows how fast the function changes in reaction to moving from x=2 to x=2.01. In other words, the slope shows function steepness at the given point.
Let’s also build the tangent for our height(age) function:
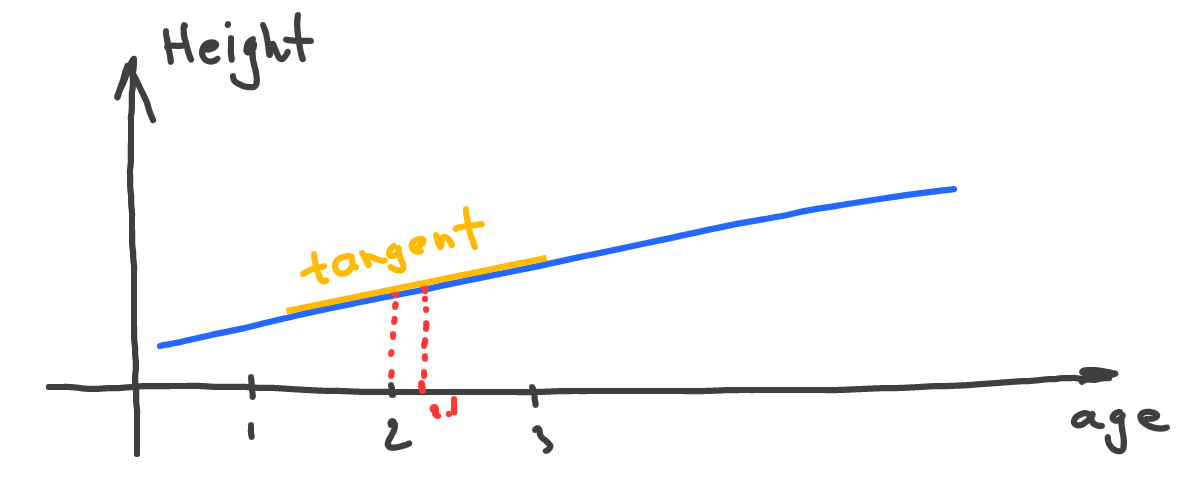
Interesting - our tangent is the same as our main function line. Well, in this case, the tangent is not actually tangent, but the idea stays the same - the yellow line shows how the function changes its direction and the strength of that change.
Derivatives
This article is about derivatives and we’re past half an article, but we haven’t seen any mention of derivatives. So what’s that?
Let’s take our height(age) function and calculate how Y changes, not only for x=2 point but for multiple points:
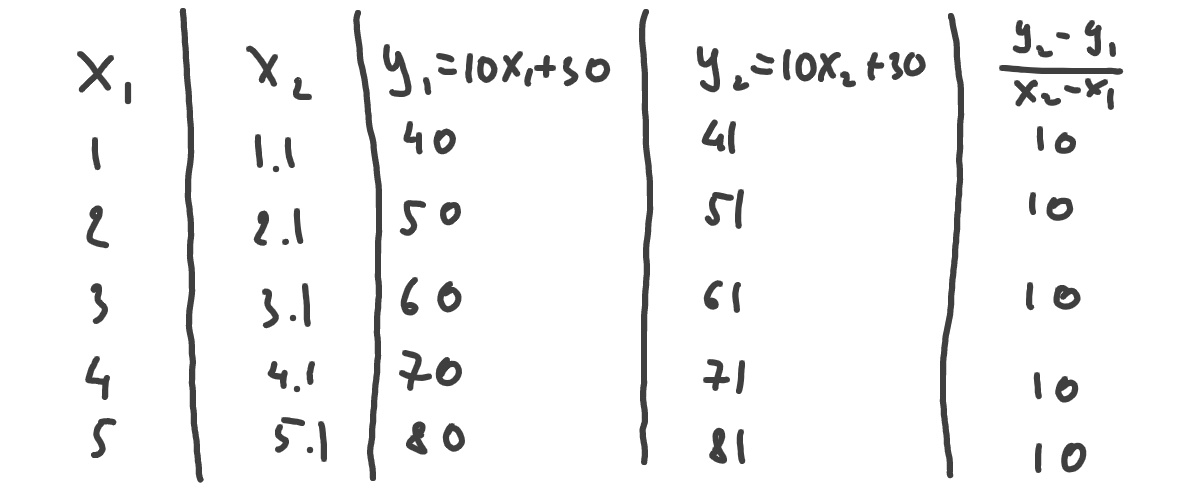
Interesting, that our change is always 10. If we now draw that as a line, we get a straight line parallel to the x-axis:
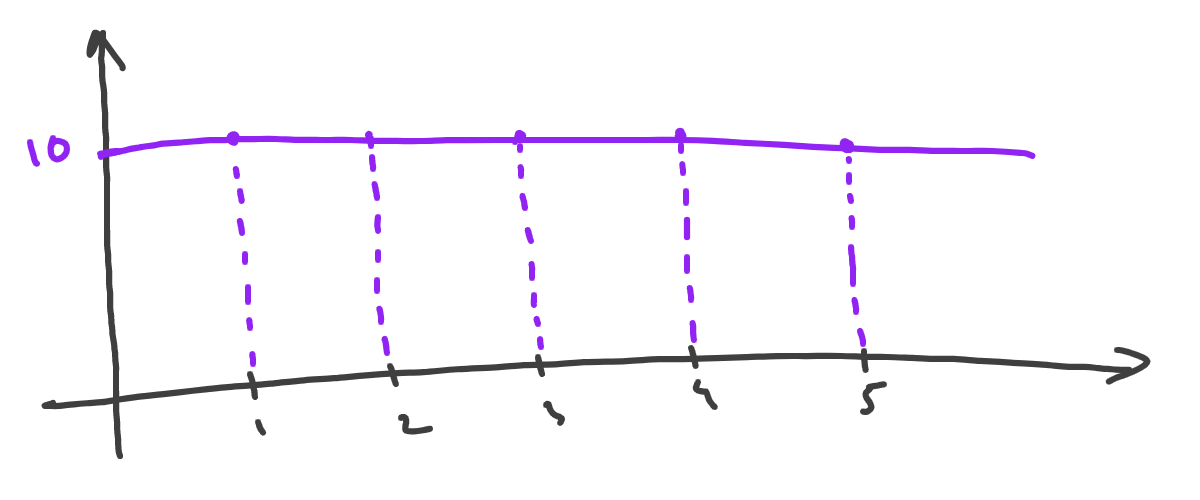
What that means, is for any point of our function, its change strength and direction will also be defined by the constant value of 10. So, at any point, if we move slightly to the right, Y always increases and is always 10 times stronger than the x change.
Now let’s do the same calculations, but for the other function, which is more complex. Let’s also take more points to calculate - on a range -5...5 and with a step of 0.5:
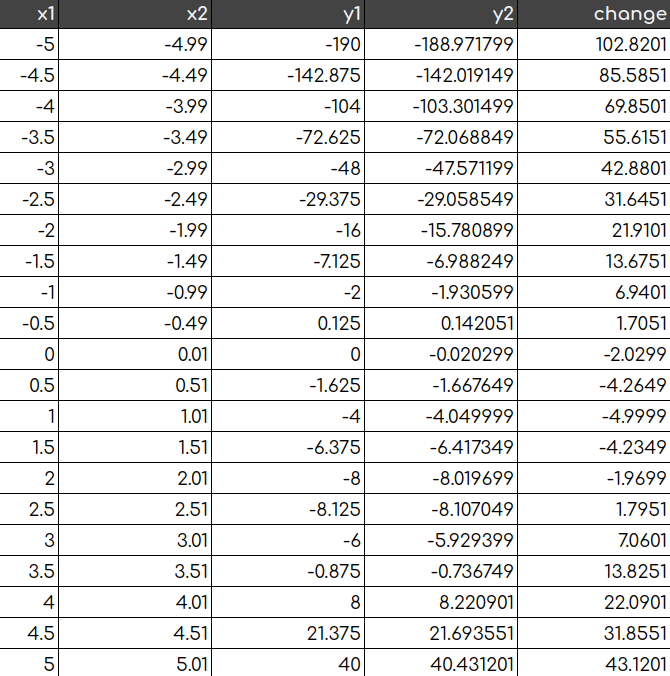
If we connect the dots, we get something similar to the following:
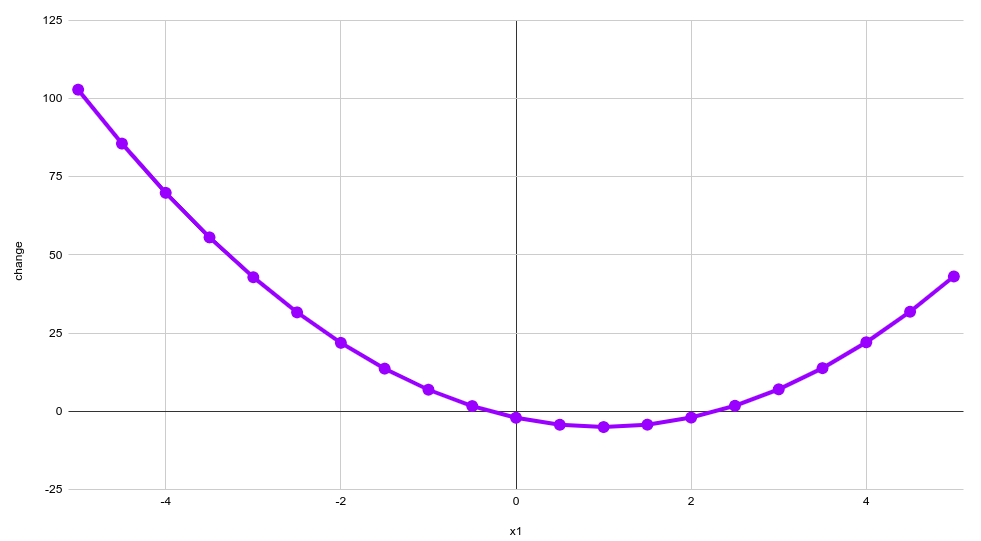
Let’s think a bit about it. We can calculate the value of change for any x of our original function. As we remember, a function shows one variable dependency on another variable. So, probably, we can define some sort of function that describes that dependency of change on x:
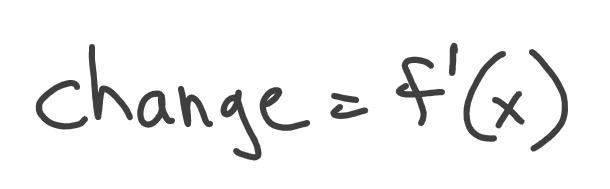
We’ve marked our function with f'(x) not to confuse it with the original f(x). So f'(x) shows the direction and strength of change of f(x) at any given point. That’s what derivative is.
Let’s try to understand how the derivative will look for our height(age) function. We know from previous calculations that it has the value of 10 for any x. So it doesn’t depend on x at all and is just a static number:
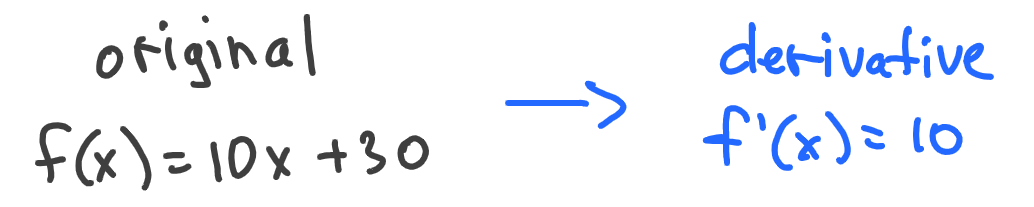
Yep, that’s a function that has the same value of 10 for any possible value of x.
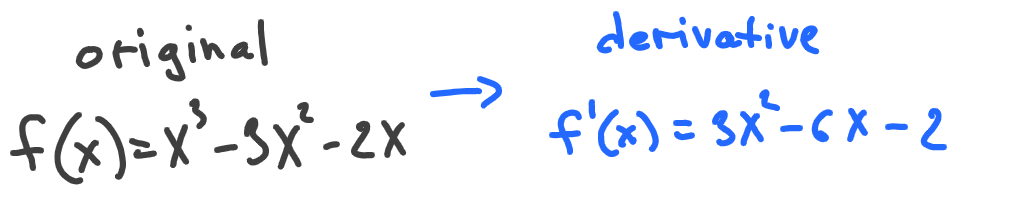
That was easy, but the second example is tricky. It’s not that easy to tell what function describes the kind of chart we’ve got. Well, it looks like some parabolic function, but what exact function?
There’s a whole section in math that covers calculations of derivatives for different kinds of functions. That’s just a set of rules (or an algorithm), like - multiplying something, adding something else, then dividing it by something, etc. Given those rules, we can calculate the derivative for our case:
If you don’t want to deal with calculus, there’s a fascinating tool called Wolfram Alpha that can calculate and plot derivatives automatically. We can also make sure that the derivative of f'(10x+30) = 10 to confirm our previous calculations.
So, the derivative of the function is another function, that shows how the original function changes (strength and direction) at any given point.
Derivative shows how we increase or decrease something
We can calculate the derivative of any function. And by knowing the derivative, we can understand which way should we move from a certain point to increase or decrease that function value.
Another cool feature of derivatives is that they become zero at so-called points of local extrema - the point where the function changes its sign:
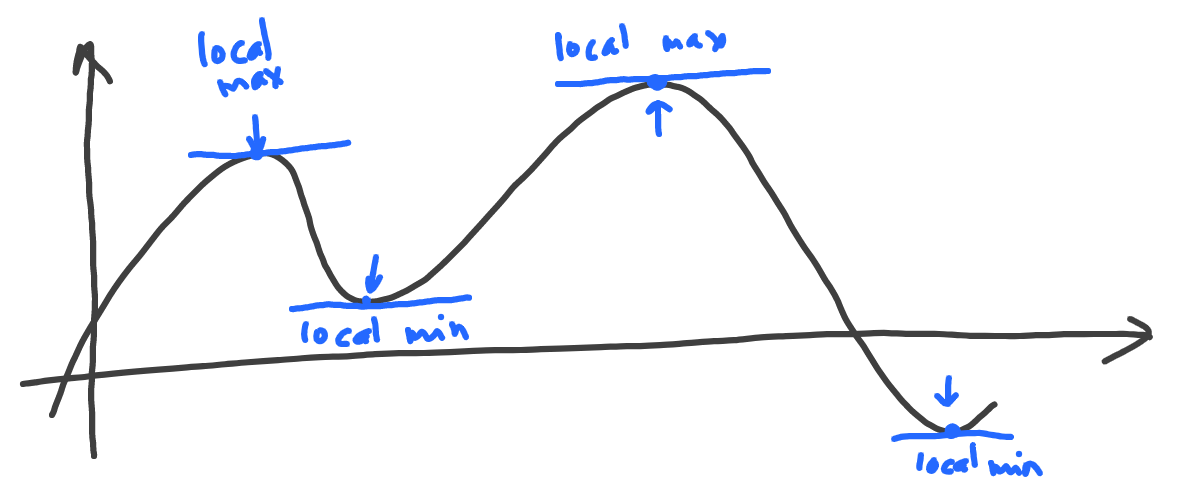
There are two types of local extrema. Local maximums are the points where the function goes from growing to falling, and local minimums are the points where the function goes from falling to growing.
Those features of derivatives are used in machine learning to minimize loss functions. The idea is that we set up our model (e.g., some function with unknown parameters), then set random parameters, then calculate how far resulting values are from training targets (this “farness” is a value of the loss function), and then we change parameters in the direction derivative tells us to go to the point where the loss function is minimal (and this is repeated many times till results are cool).
Let’s program a simple example. Suppose we have a simple function that we want to optimize:
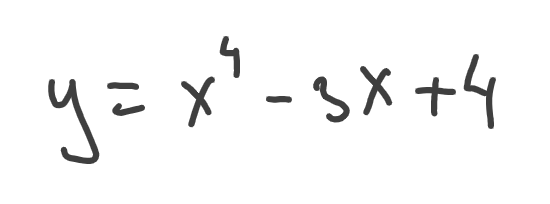
Our goal is to find x where the original function returns the minimum value. First, let’s find this function derivative:
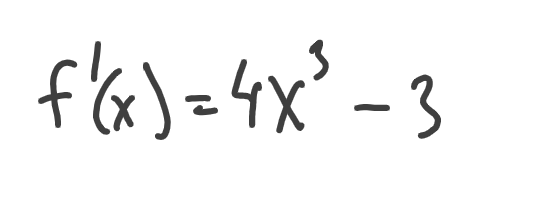
Now, let’s create a Python function, that will return the value of the derivative for any given x:
def derivative(x):
return 4*x**3-3derivative— the name of the function that returns the derivative value4*x**3-3— calculate and return derivative value atx
Now, the idea is to pick the starting point and move step by step in the opposite direction of the derivative (because we’re looking for a way to minimize, not maximize the original function) till we reach zero (with a sufficient level of precision):
x = 0
step = 0.01
iterations = 0

while True:
  d = derivative(x)

  if abs(d) < 0.1:
    break

  iterations += 1
  dir = -d/abs(d)
  x = x + step * dir

print(round(x, 1), 'found after', iterations, 'iterations')
0.9 found after 90 iterationsx = 0— this is our starting pointstep = 0.01— we’re going to changexby this valued = derivative(x)— calculate derivativebreak— it’s OK for our precision requirements to stop whenabs(d)is less than0.1(we suppose that it’s a zero)dir = -d/abs(d)— direction of movement is the opposite of what derivative shows us (divided by derivative because we want only a sign)x = x + step * dir— we changexbystepin a direction ofdir
This algorithm has detected, that approximately at the point where x=0.9, our original function will have its minimum value. And that is quite correct. What’s most important here, is that we actually never calculated or referred in any way to the original function itself. So derivatives give us a tool to optimize (minimize or maximize) functions. And that’s exactly what we need to do with loss functions in machine learning to build models with the least error values.
- (@plan: Loss (error) functions in machine learning)
Edit this article on Github